CfPB Benchmark 2016
24 march 2016
The CfPB Benchmark shows how satisfied and dissatisfied employees are, on average, about the main elements of the work environment. The results are based on a total of 134 different studies with 22.410 respondents from 52 different organizations. In all these studies the online questionnaire WODI was used.
This year the results of over 2500 respondents from 12 different case studies were added to the CfPB Benchmark. In recent years the proportion of results from flexible offices, also called activity-related work environments, has become more substantial. Separate indicators are calculated for the different types of offices in our WODI database. This creates the opportunity for organizations to compare their own results to the most closely comparable offices.
The data contained in the CfPB Flex Benchmark is growing steadily. In 2016, it includes surveys with the results of 68 different cases (12,395 respondents). This indicator is increasingly used as a benchmark. The graph below clearly shows what the main strengths and weaknesses are, according to employees of these ‘flexible offices’.
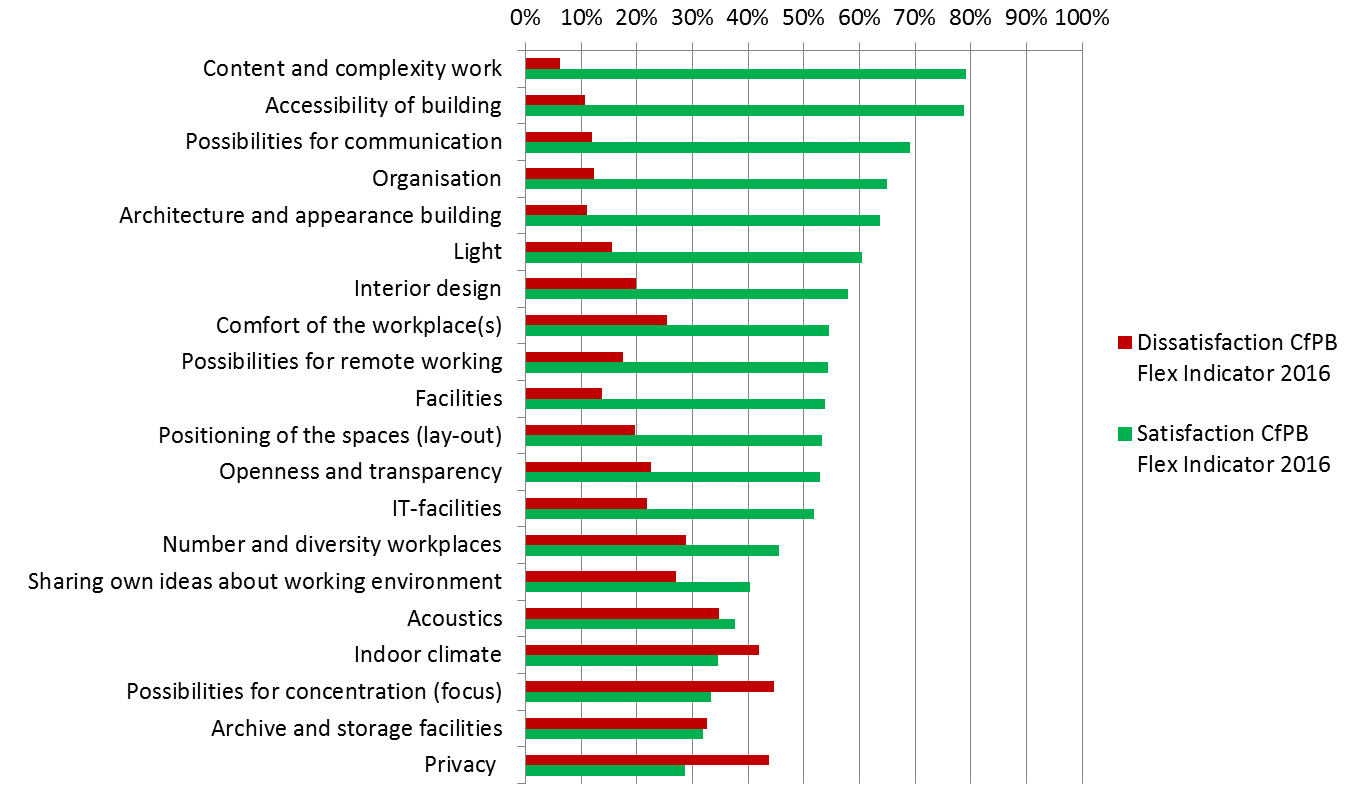
Figure 1: CfPB Flex Benchmark 2016: the average percentage of respondents (very) satisfied or (very) dissatisfied with work environment aspects. Respondents who replied ‘neutral’ are not shown in the figure.
The lower part of the graph shows the biggest problems people experienced. They are: privacy, filing and the archive, the concentration possibilities, the indoor climate and acoustics.